Decoding Instrumentation Diagrams for Industrial Control Systems
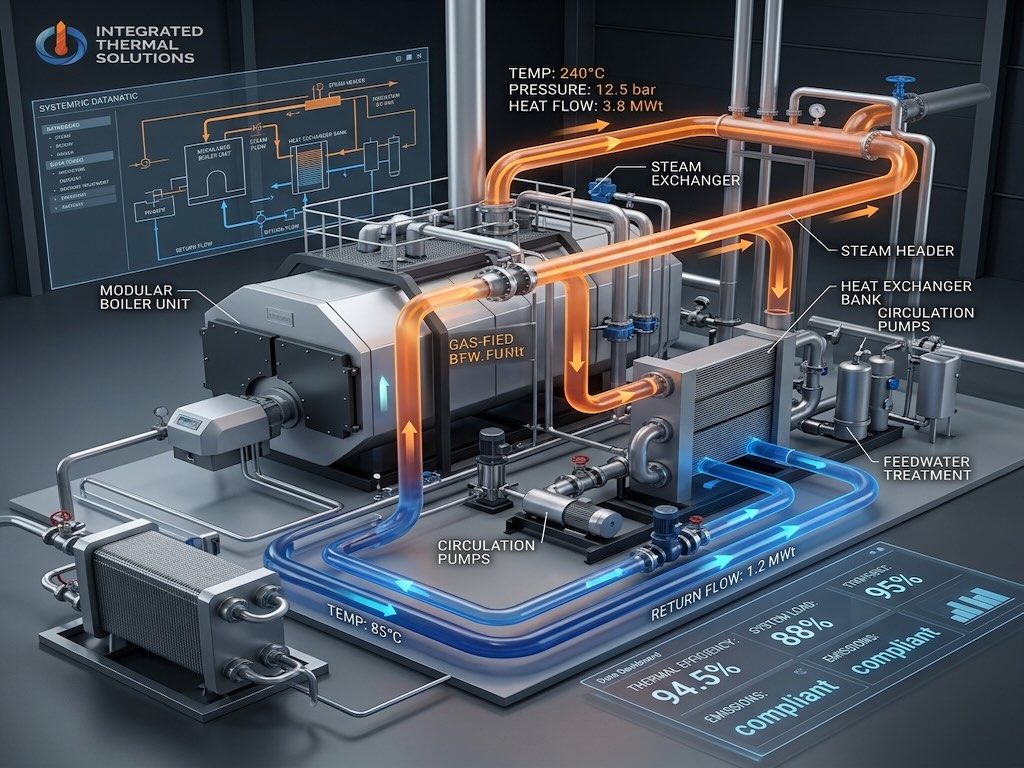
In complex industrial environments, mechanical equipment is only as good as the brain controlling it. Instrumentation diagrams are the critical link between heavy mechanical engineering and automated operational logic. Whether you are controlling a massive high-pressure boiler or a delicate distillation column, accurate instrumentation schematics ensure that every sensor, transmitter, and control valve functions in perfect harmony.
What are Instrumentation Diagrams?
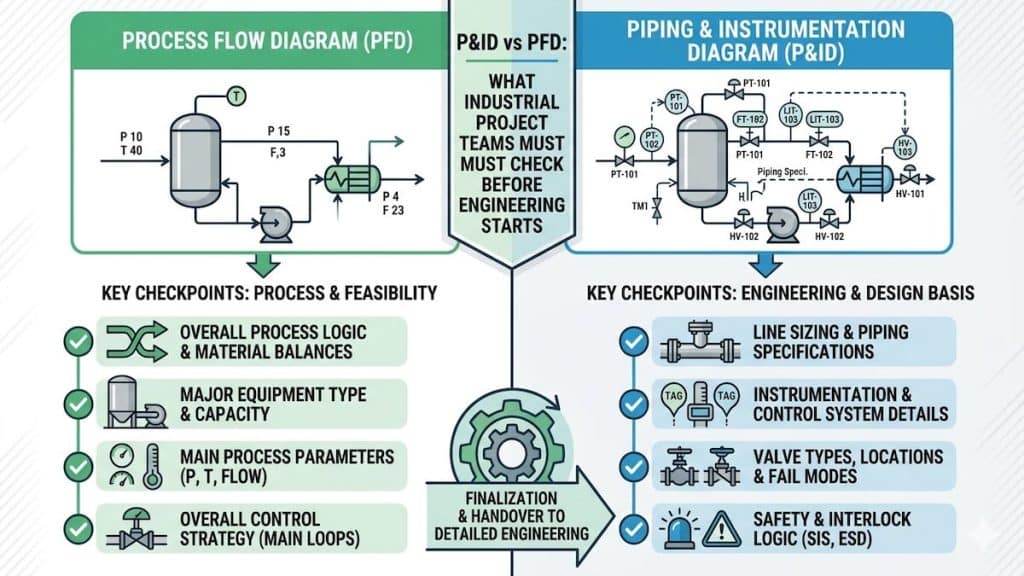
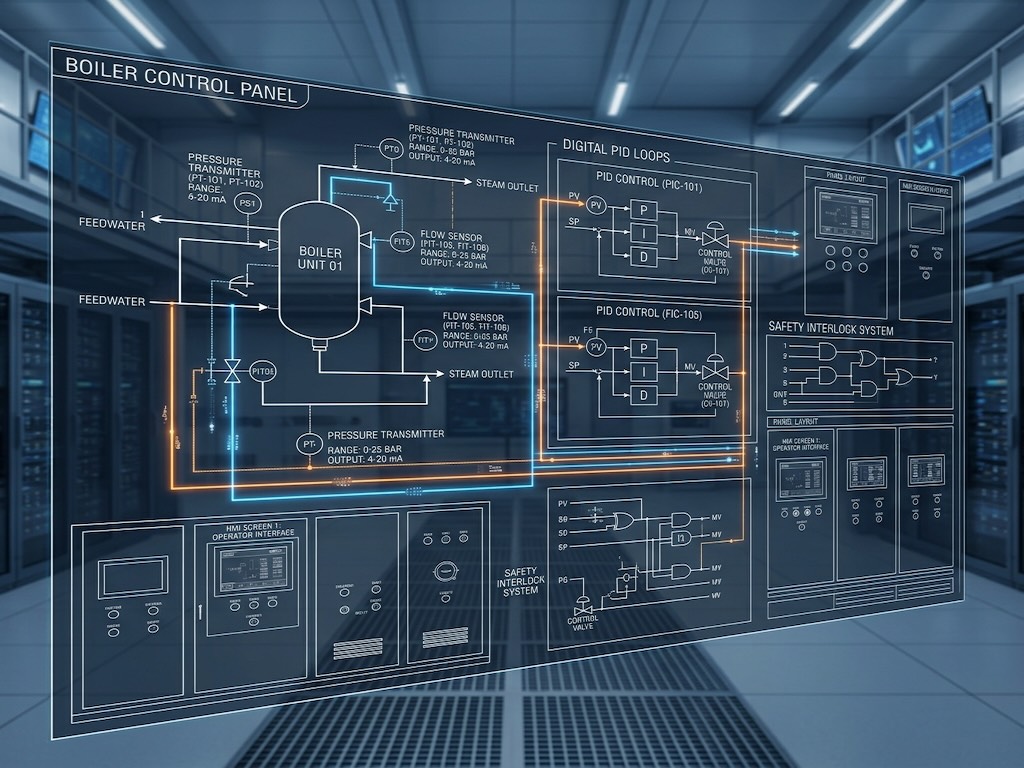
Instrumentation diagrams are highly detailed engineering blueprints that map out the automated control loops of an industrial process. They display the exact locations and types of sensors (pressure, temperature, flow), how they transmit data back to a central computer (PLC or DCS), and how the computer physically actuates valves to maintain safe process setpoints.
The Core Elements of a Control Loop
To read or design instrumentation diagrams, engineers must understand the anatomy of a control loop. A standard closed-loop system consists of four primary phases:
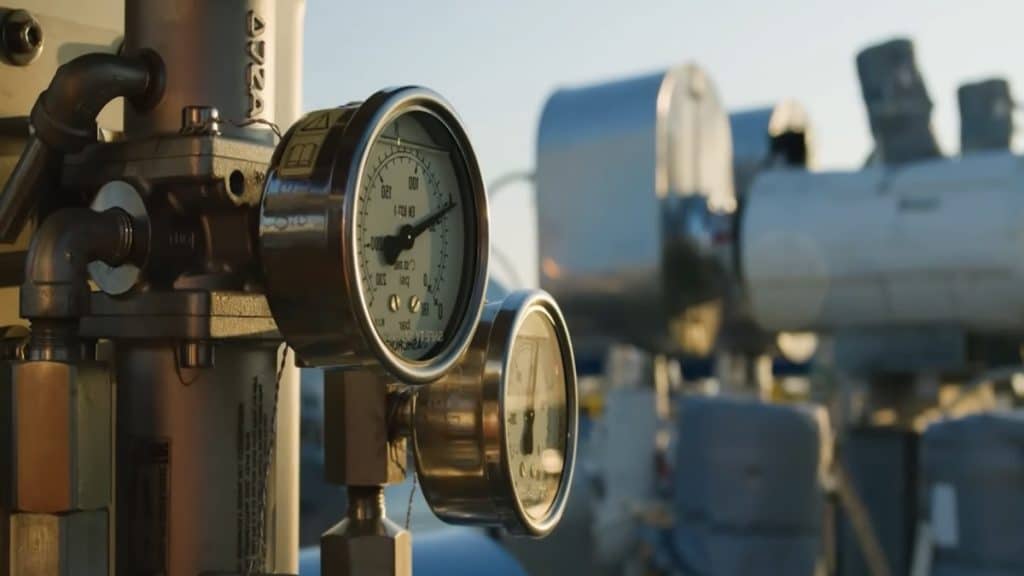
- The Sensor (Primary Element): A physical device inside the pipe or vessel that measures a process variable. For example, a thermocouple measuring steam temperature.
- The Transmitter: Converts the raw sensor reading into a standardized electronic signal (typically 4-20mA) and sends it to the control panel.
- The Controller (PLC/DCS): The computer that receives the signal, compares it to the desired “setpoint,” and calculates if an adjustment is necessary using PID (Proportional-Integral-Derivative) logic.
- The Final Control Element: Typically an automated control valve that physically opens or closes to adjust the fluid flow, thereby correcting the process temperature or pressure.
Understanding ISA Instrument Tagging
A crucial part of our PFD/P&ID engineering services is ensuring that every instrument is properly tagged according to ISA (International Society of Automation) standards.
| First Letter (Measured Variable) | Succeeding Letters (Function) | Example Tag | Meaning |
|---|---|---|---|
| P (Pressure) | IC (Indicating Controller) | PIC-101 | Pressure Indicating Controller (Loop 101) |
| T (Temperature) | T (Transmitter) | TT-205 | Temperature Transmitter (Loop 205) |
| F (Flow) | CV (Control Valve) | FCV-302 | Flow Control Valve (Loop 302) |
| L (Level) | A (Alarm) | LAHH-400 | Level Alarm High-High (Loop 400) |
Frequently Asked Questions
Why is the 4-20mA signal standard for instrumentation diagrams?
The 4-20 milliamp signal is immune to electrical noise and voltage drops over long distances. Furthermore, using 4mA as the \”zero\” point ensures that if a wire is cut (0mA), the system immediately recognizes a fault, rather than mistaking it for a zero reading.
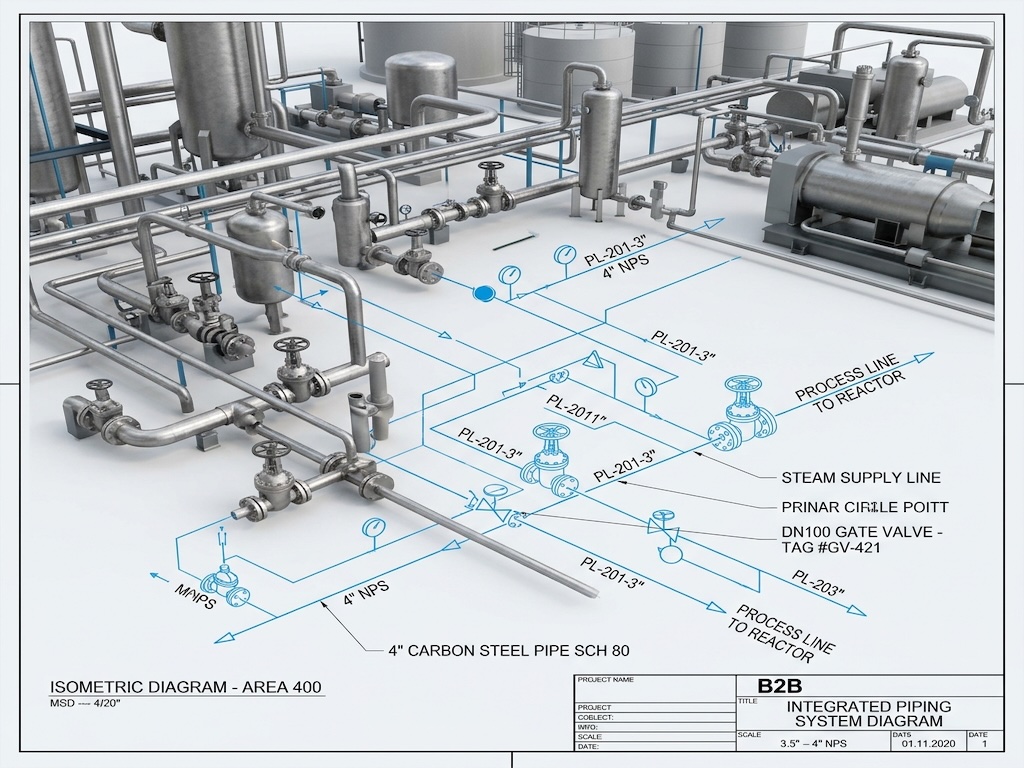
What does a solid line vs a dashed line mean?
A solid line represents a physical pipe carrying fluid. A dashed line represents a discrete electronic signal (like 4-20mA or digital data) traveling through a wire between an instrument and the control panel.
Can instrumentation diagrams help size equipment?
No, instrumentation diagrams only show control logic. To actually size equipment, you must use specialized tools like a boiler sizing calculator or hydraulic modeling software based on the process flow data.
What is a Safety Instrumented System (SIS)?
An SIS is an independent, redundant control system designed solely to prevent catastrophic accidents. If the primary control system fails, the SIS overrides everything to safely shut the plant down.
Expert Control Systems Engineering
Designing robust control loops requires a deep understanding of both fluid dynamics and electrical engineering. At Heating Formula, our consultancy team develops flawless instrumentation diagrams that guarantee your facility operates safely, efficiently, and autonomously.