The Complete Guide to the P&ID Piping and Instrumentation Diagram in Industrial Engineering
In modern industrial engineering, clarity and precision are non-negotiable. Whether you are designing a complex chemical plant or optimizing an HVAC network, the P&ID piping and instrumentation diagram serves as the master blueprint. This detailed schematic connects the conceptual process flow with the physical reality of pipes, valves, and control systems. Understanding how to properly interpret and design a P&ID piping and instrumentation diagram is the cornerstone of safe, efficient, and compliant facility operations.
What is a P&ID Piping and Instrumentation Diagram?
A P&ID piping and instrumentation diagram is a highly detailed engineering schematic that illustrates the piping components, process equipment, and control instrumentation required to operate a physical process plant. It provides critical technical data including pipe sizes, valve types, sensor locations, and flow directions for system construction and maintenance.
Why the P&ID Piping and Instrumentation Diagram is Critical for B2B Projects
For industrial contractors, project managers, and lead engineers, the P&ID is much more than a simple drawing. It is the definitive legal and technical document that drives procurement, construction, and safety audits. When creating a PFD/P&ID engineering package, accuracy dictates budget.
A flawed P&ID piping and instrumentation diagram can lead to ordering the wrong valve sizes, missing critical pressure relief systems, or failing safety compliance checks. Conversely, an expertly optimized P&ID ensures a smooth transition from process design simulation directly into physical construction and commissioning.
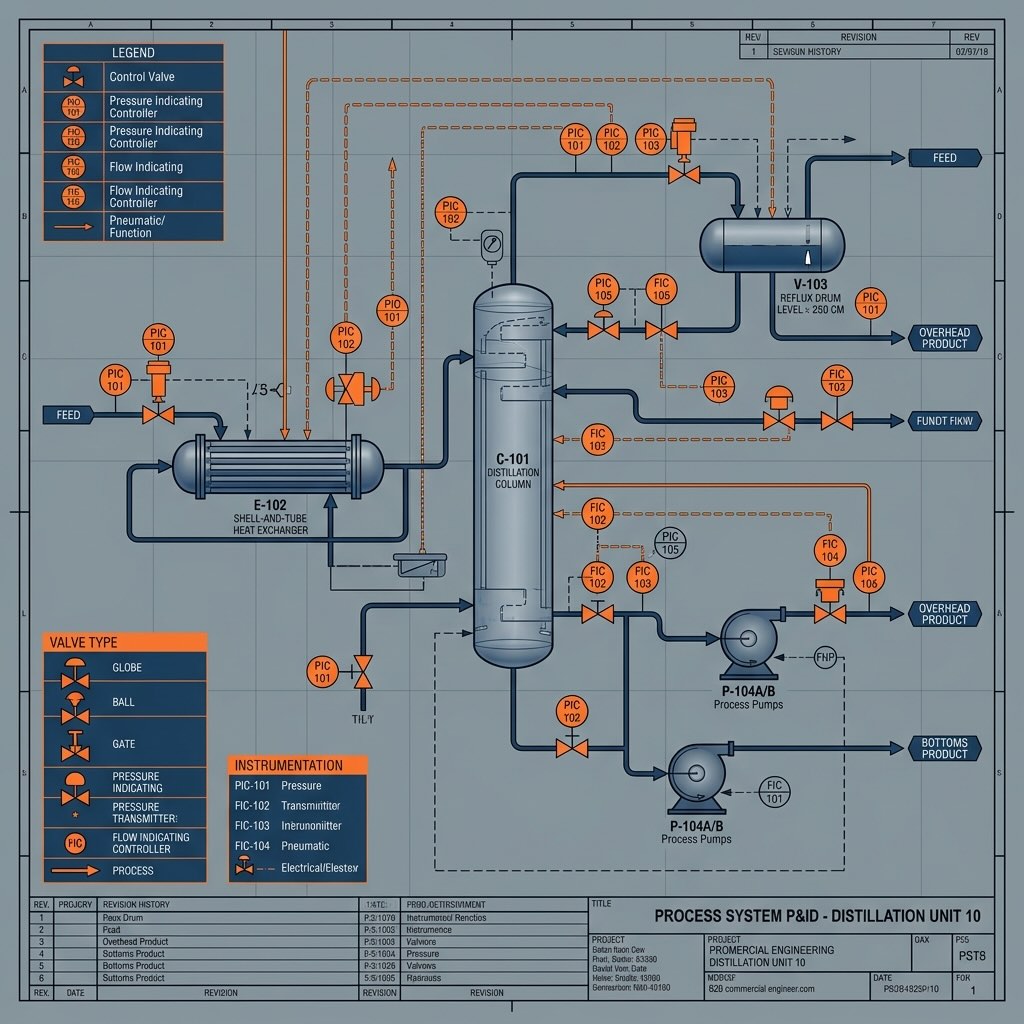
How to Read a P&ID Piping and Instrumentation Diagram
Interpreting a P&ID requires familiarity with standardized symbols, typically governed by ISA (International Society of Automation) standards. Here is a step-by-step approach to decoding any P&ID piping and instrumentation diagram:
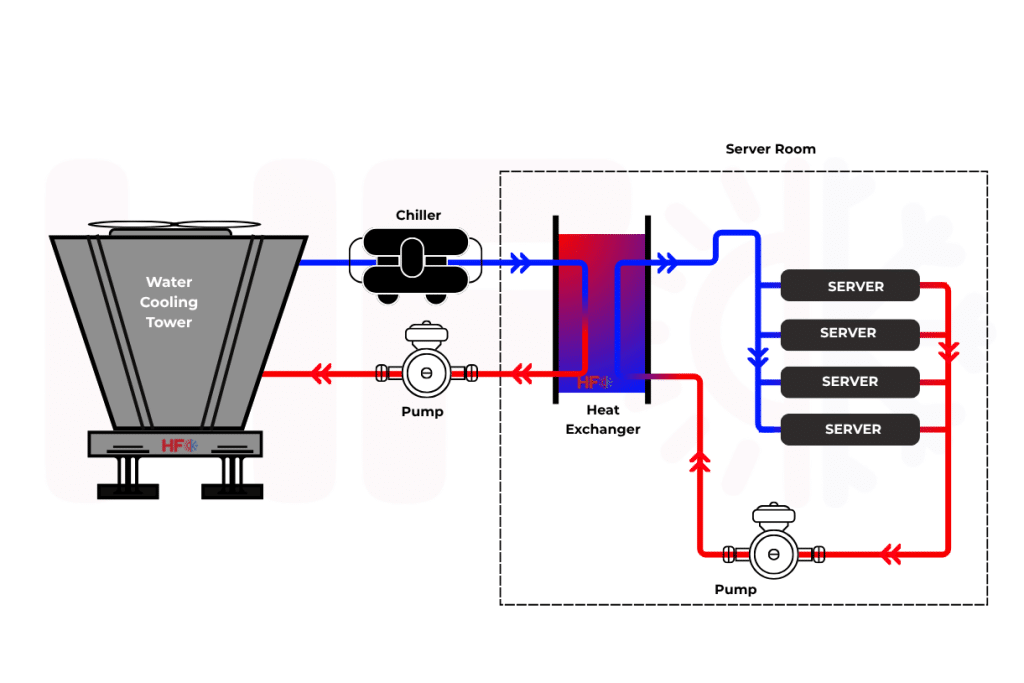
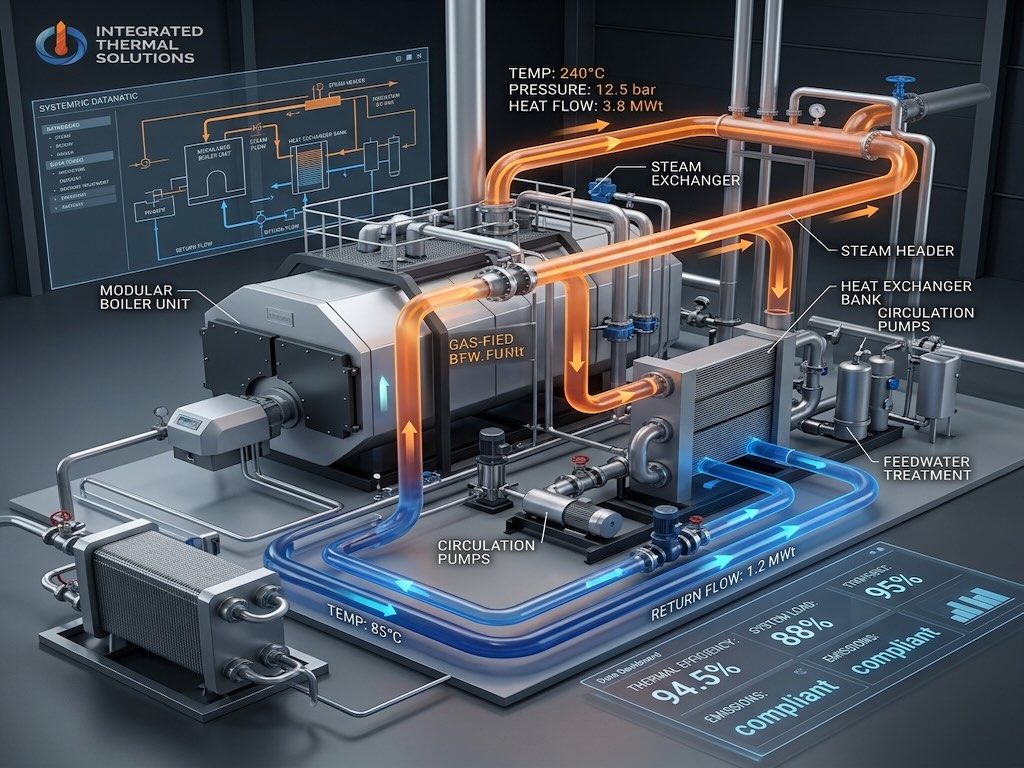
- Identify Main Equipment: Start by locating the major vessels, heat exchangers, pumps, and compressors. These form the backbone of the process.
- Trace the Main Flow: Follow the thickest piping lines from the feed inlet to the final product outlet. Pay attention to flow direction arrows.
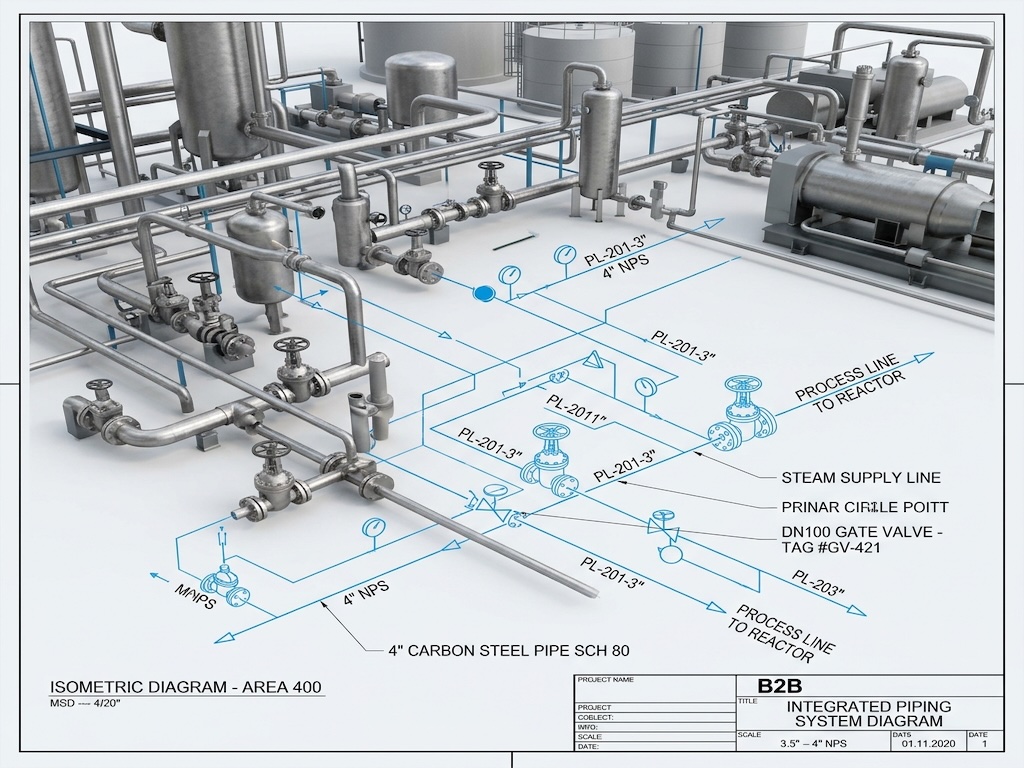
- Analyze Pipe Specifications: Read the line numbers. A typical tag (e.g., 4″-CS-150) indicates the pipe diameter (4 inches), material (Carbon Steel), and pressure rating (Class 150).
- Locate Control Valves: Identify where flow, pressure, or temperature is manipulated. Look for the “bow-tie” symbols representing valves.
- Interpret Instrumentation Bubbles: Locate the circles attached to the process lines. The letters (e.g., FIT for Flow Indicating Transmitter) define the instrument’s function.
- Trace Signal Lines: Differentiate between physical pipes (solid lines) and electrical/pneumatic control signals (dashed or crossed lines).
- Review Safety Systems: Identify Pressure Safety Valves (PSV) and emergency shutdown loops.
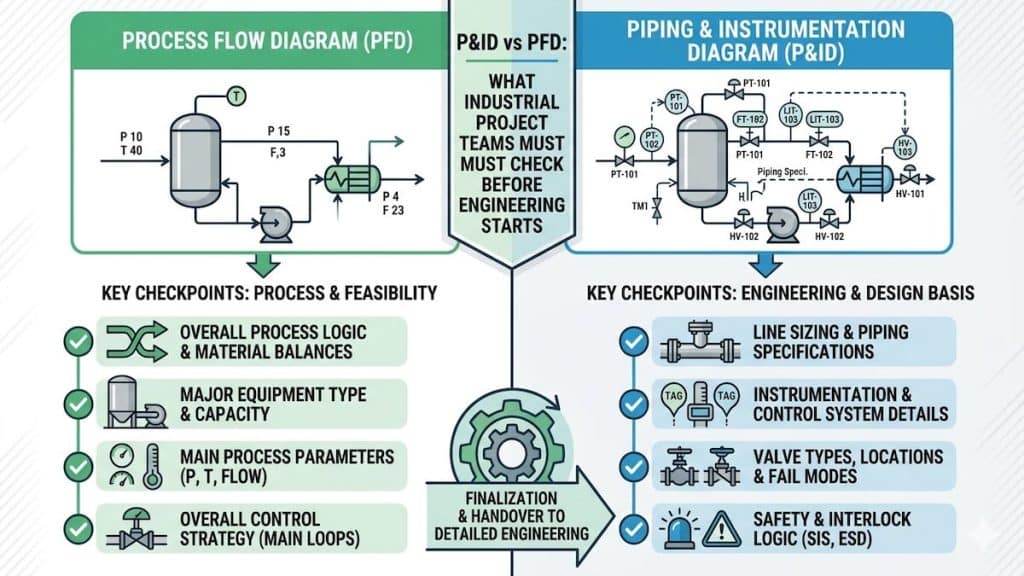
Comparing PFD vs. P&ID
A common point of confusion in engineering is the difference between a Process Flow Diagram (PFD) and a P&ID piping and instrumentation diagram. The table below clarifies their specific use cases in industrial design.
| Feature | Process Flow Diagram (PFD) | P&ID Piping and Instrumentation Diagram |
|---|---|---|
| Primary Purpose | Conceptual design and heat/mass balance | Detailed engineering, construction, and control |
| Equipment Details | Major equipment only (general shapes) | All equipment including spares and internals |
| Piping Details | Main process lines only; no sizing | All process/utility lines, sizes, classes, and insulation |
| Instrumentation | Only critical control loops | Every sensor, transmitter, controller, and safety valve |
| Used By | Process Engineers for initial planning | Mechanical, Electrical, and Piping Designers |
Frequently Asked Questions
What software is used for P&ID piping and instrumentation diagram design?
AutoCAD P&ID, SmartPlant, and AVEVA are the industry standard software platforms used for creating a P&ID piping and instrumentation diagram. These programs offer automated tag management and integration with 3D modeling software.
Who is responsible for approving a P&ID?
A lead process engineer typically holds the final responsibility for approving a P&ID. However, the review process involves input from mechanical, instrumentation, and safety engineering disciplines to ensure full compliance.
What are ISA symbols on a P&ID?
ISA symbols are globally recognized graphical standards created by the International Society of Automation. They ensure that any engineer, regardless of location, can read and understand the P&ID piping and instrumentation diagram accurately.
How often should a P&ID be updated?
A P&ID must be updated immediately whenever a physical change is made to the plant. Keeping these diagrams in an “As-Built” state is a critical safety and regulatory requirement for industrial facilities.
Can a P&ID show physical pipe routing?
No, a P&ID does not show physical pipe routing, elevation, or scale. It is a logical schematic. Physical layout is handled during piping design analysis using 3D modeling software.
Professional P&ID Design Services
Developing an accurate P&ID piping and instrumentation diagram requires deep multidisciplinary expertise. An error in the diagram stage will multiply in cost once steel is cut and pipes are welded. At Heating Formula, our engineering team specializes in creating robust, compliant, and highly optimized P&IDs for industrial processes, HVAC systems, and thermal energy networks.